Claims Analysis

When working with large trucking companies, claims are bound to happen. It is imperative that claims are carefully tracked and managed in order to understand a company’s history of claims, trends, and how to improve going forward. In order to share claim experience with clients and new prospects I helped create an excel spreadsheet that could be used to track claims in an easy and very visually appealing manner. I am very proud of this spreadsheet as it has been used by our business to bring on clients, keep current clients, and has been received very well by these individuals and companies. Below is a made up example of how the claims analysis spreadsheet works.

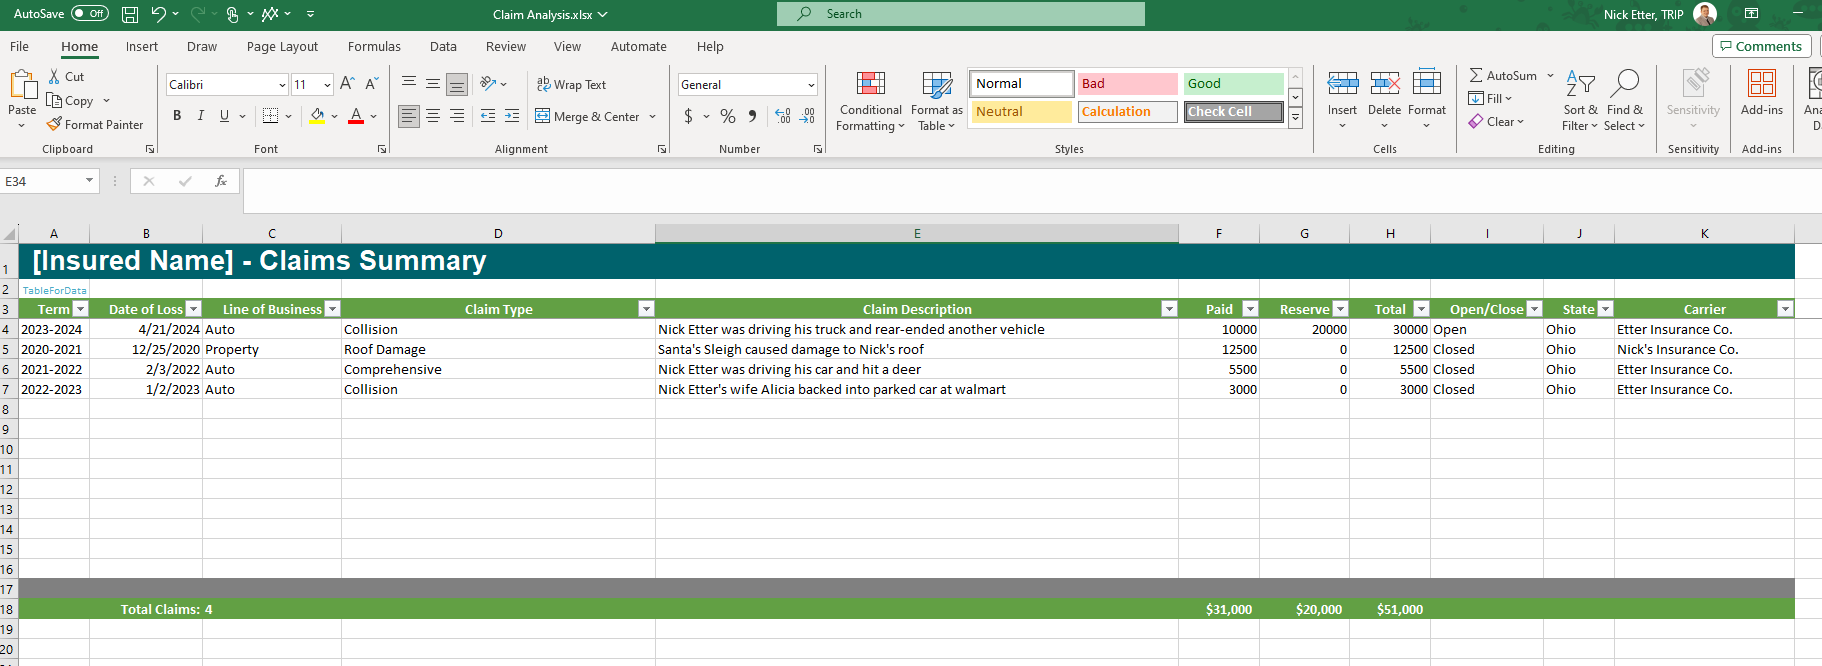
Step One - Data Entry
The first page of the spreadsheet is where the claim data is entered. I have included fake examples of claims in order to show what it this should look like.
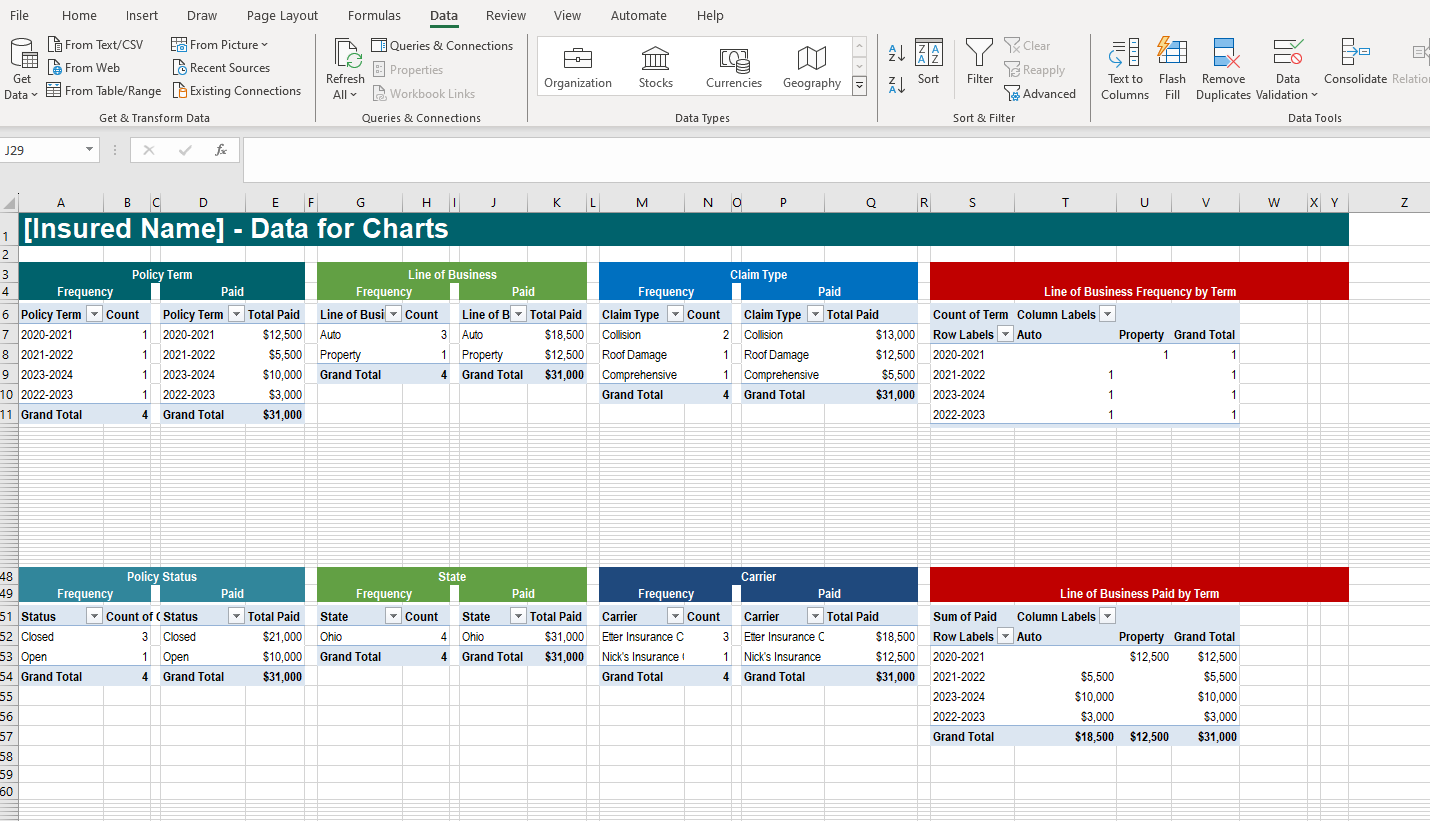
Step Two - Refresh data in order to populate the rest of the spreadsheet including graphs
Under the Data tab in Excel one would select “Refresh All” and the data in the second tab of the document populates. Once completed the rest of the excel document will populate and the graphs and charts will be ready as well.
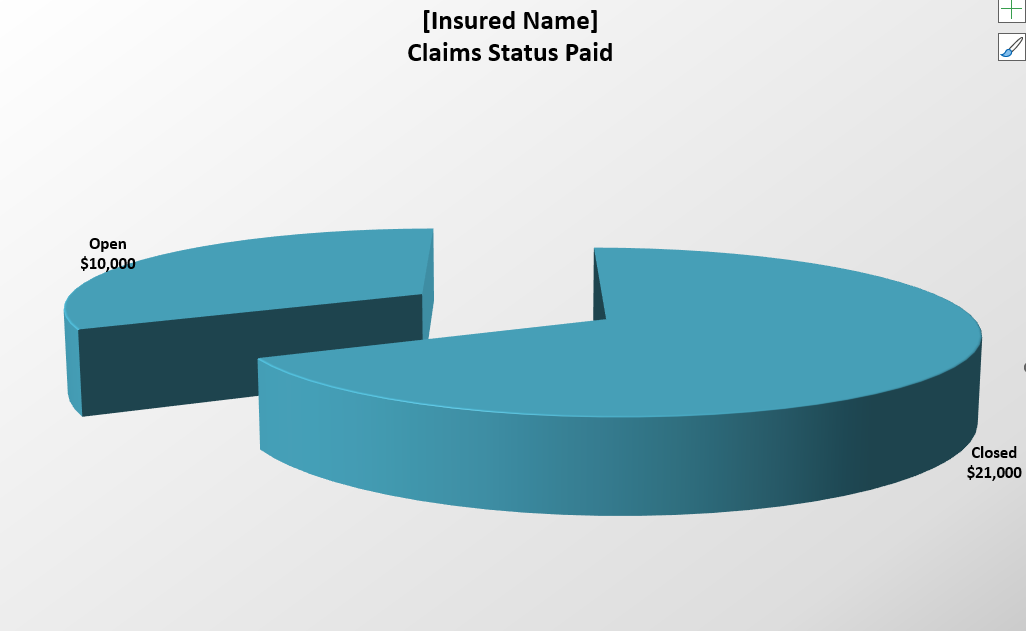
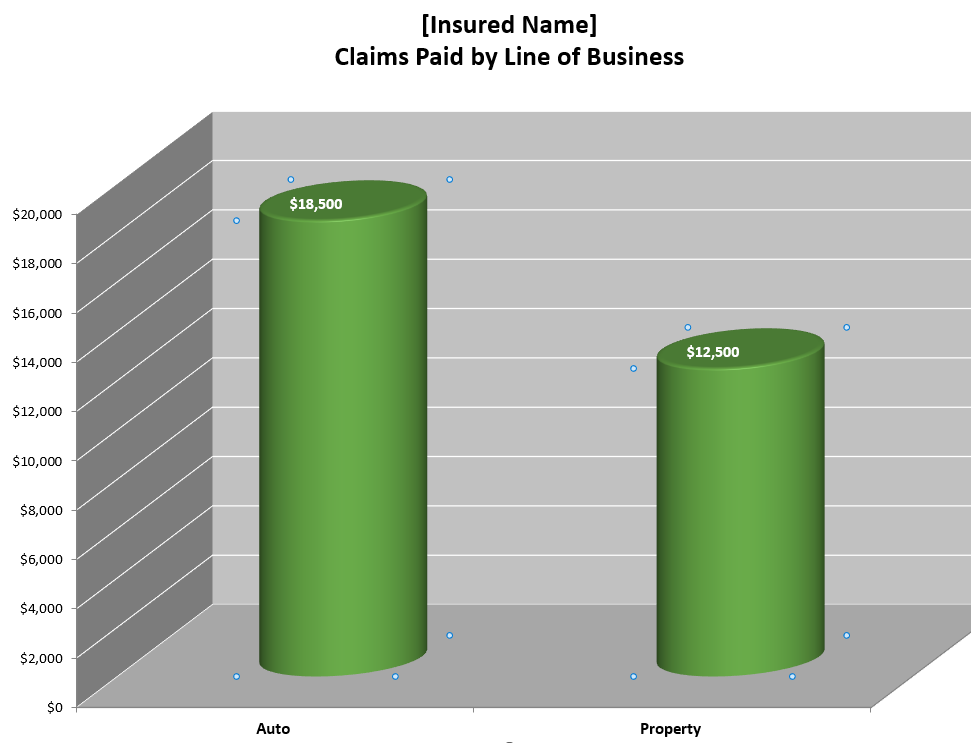
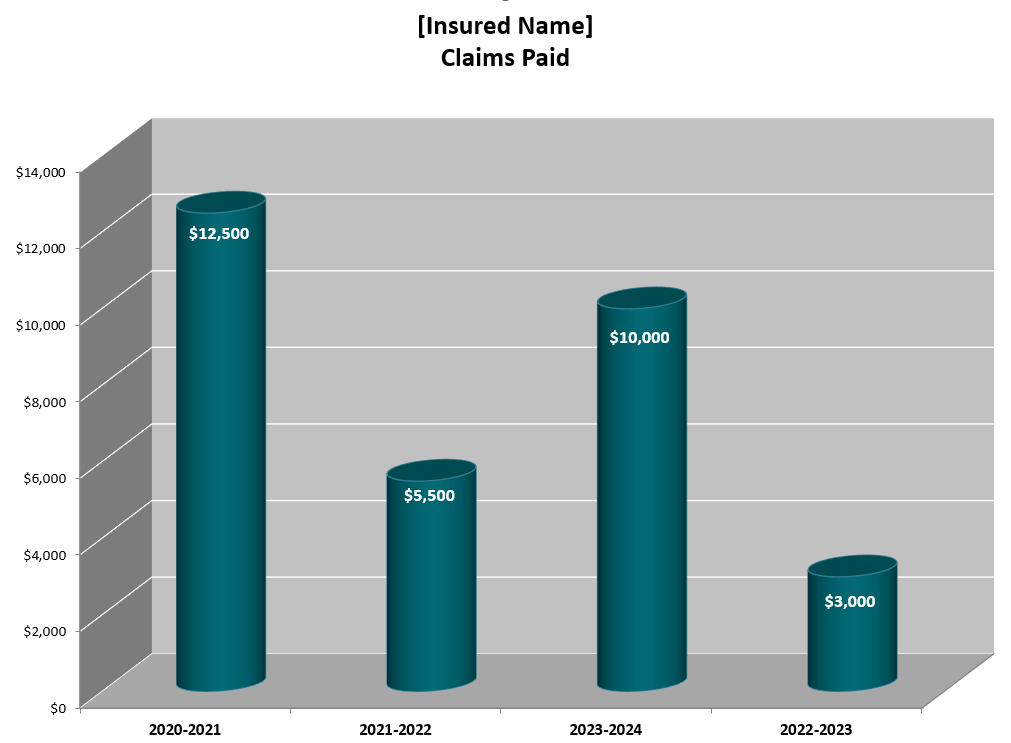
Step Three - Customization
Each individual client is different and has different needs. The user is able to go through the remainder of the document and select the graphs and charts that they would like to use when showing to a client, carrier or other person. Below you will find four of my favorite charts available that I seem to use more than any others.